
Plan and record manpower
Read crew demand week by week, set a planned headcount, and record what actually turned up.
Last updated
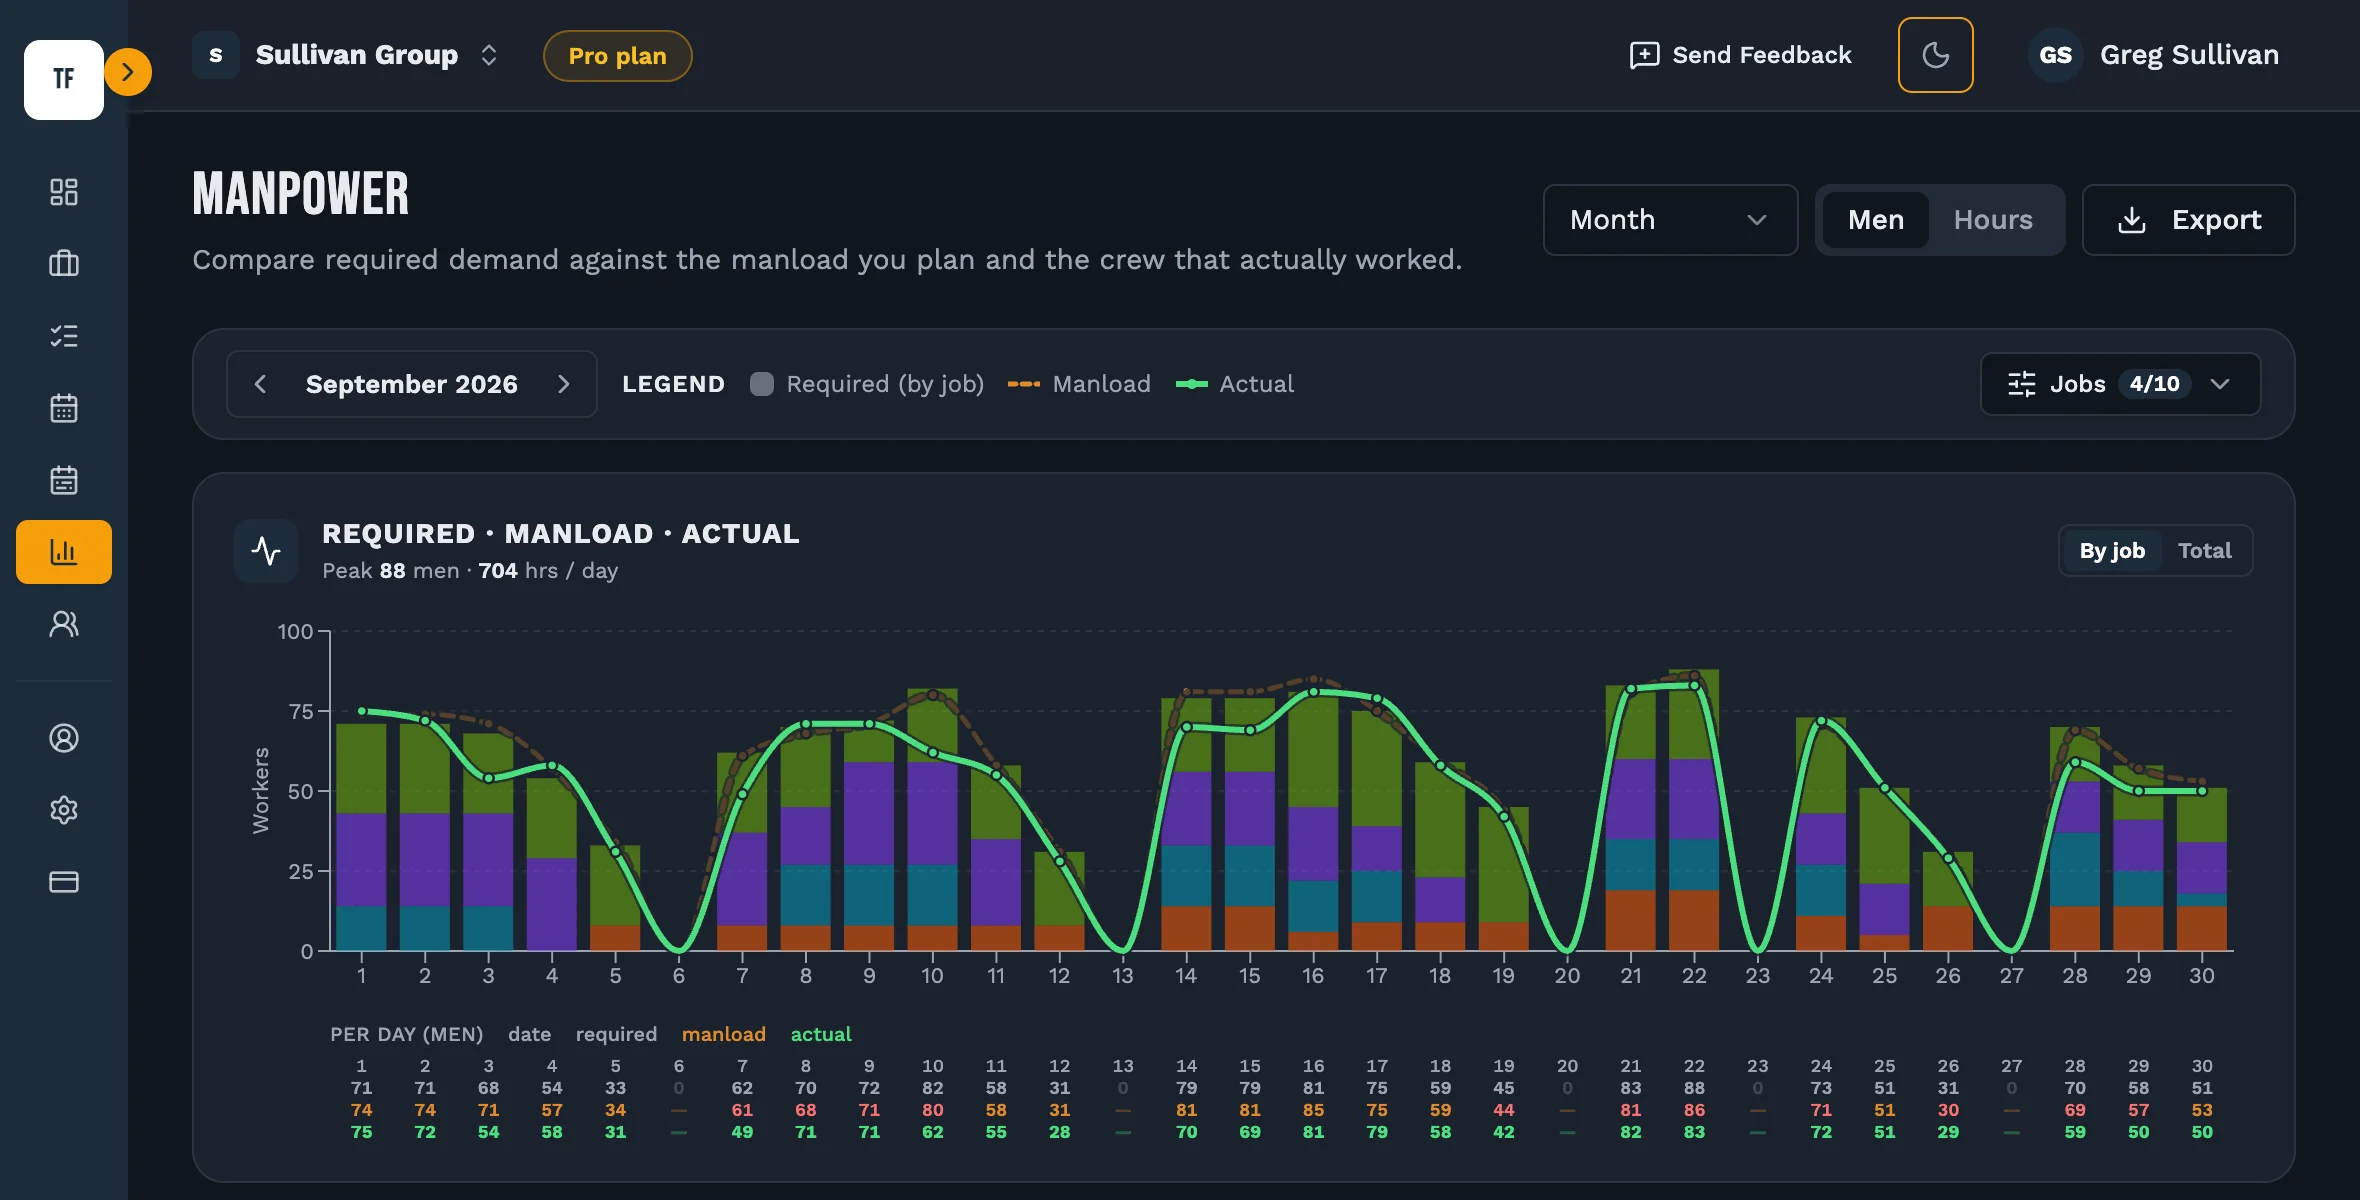
The manload chart adds up the crew size of every activity running on each day and stacks it by job. It is calculated, not typed: change a duration or a crew size anywhere and this chart moves with it.
On top of that you can record two more numbers — what you planned to have on site, and what you actually had. The gap between the three is the thing worth looking at.
Open Manpower
Choose Manpower in the sidebar. The stacked columns are demand calculated from your schedule, one colour per job.
Find the peak
Look for the tallest columns. That's the week you need the most people, and it's usually easier to move an activity now than to find six extra hands then.
Enter planned crew
Use the crew planner to set the headcount you intend to have on site. It draws over the demand so you can see where you're short before it happens.
Record actuals as you go
Enter what actually turned up. Over a few weeks this gives you a real picture of how your plan compares to the job, which is what makes the next programme more accurate.
Narrow to one job
Use the job filter to strip the chart back to a single project when you're planning it in isolation.
Worth knowing
- Non-working days carry no demand. A day that's a holiday or a shutdown for a job contributes nothing for that job, which is why a bank holiday week dips.
- Labour hours are crew size × duration × hours per man-day. Change hours per man-day in Settings and every hours figure in the product changes with it.
Still stuck?
Tell us the job and the dates involved and we'll usually answer without a call.
Or email Support@tradeflowplanner.com